ELK Realtime logging
Page last updated:
Deprecated
This page is deprecated. Please refer to Elasticsearch.
Overview
The ELK stack consisting of Elasticsearch, Logstash, and Kibana gives the power of centralising log data and provides real-time data insights with intuitive dashboard and robust search capabilities.
Quick Tutorial
- Create the service:
cf create-service elk small testelk - Bind your app to the service and restart it:
cf bind-service APP_NAME testelk - Create some logs by visiting your web app
- Connect to Kibana
- Create the index
- See and search through your logs
Integrating the Service With Your App
After the creation of the service and the binding of the service to the application, the environment variable VCAP_SERVICES is created. Information about the credentials are stored in this variable as shown here:
{
  "elk": [
    {
      "credentials": {
        "elasticSearchHost": "77gum1z32vota000.service.consul",
        "elasticSearchPassword": "alksdjflaksdjflkal",
        "elasticSearchPort": 51760,
        "elasticSearchUsername": "1laksjdofiasjdfoia",
        "kibanaPassword": "9yqzbtQfcGPRGBDO",
        "kibanaUrl": "http://ajosijfowiqje.service.consul:57627",
        "kibanaUsername": "5E09lqW1log3va97",
        "logstashHost": "jayowj0jalstqaz1c.service.consul",
        "logstashPort": 32301,
        "syslog": "syslog://jayowj0jalstqaz1c.service.consul:32301"
      },
      "label": "elk",
      "name": "iot-logs",
      "plan": "beta",
      "syslog_drain_url": "syslog://jayowj0jalstqaz1c.service.consul:32301",
      "tags": []
    }
  ]
}
As soon as the service is bound and the application is restarted, it will start logging all the stdout including router logs automatically to logstash.
Sample Application
Swisscom: ELK Example
Administrating your ELK instances
To connect to a running ELK instance with your local development tools, you can use the cf ssh feature of the cf CLI.
Alternatively there is the possiblity to use a proxy app like the Swisscom Kibana Proxy to make your Kibana dashboard available to your browser.
Index Patterns
Index Patterns creation
To see logs within Kibana an index pattern needs to be created either specifiy the parsed* to see the parsed logs.
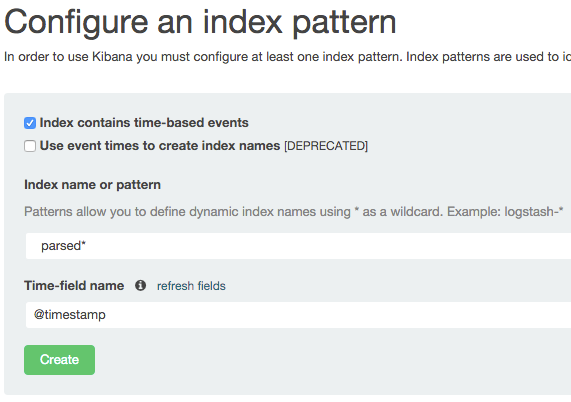
Hint:To see unparsed logs create an index pattern named “unparsed*” or create an index pattern “_all” to see all logs within the same index.
How It Works
For every app that is bound to an ELK service, the stdout ( cf logs APP_NAME) is automatically being sent to the ELK.
Optionally there is a possibility to directly sent logs to the ELK from you app.
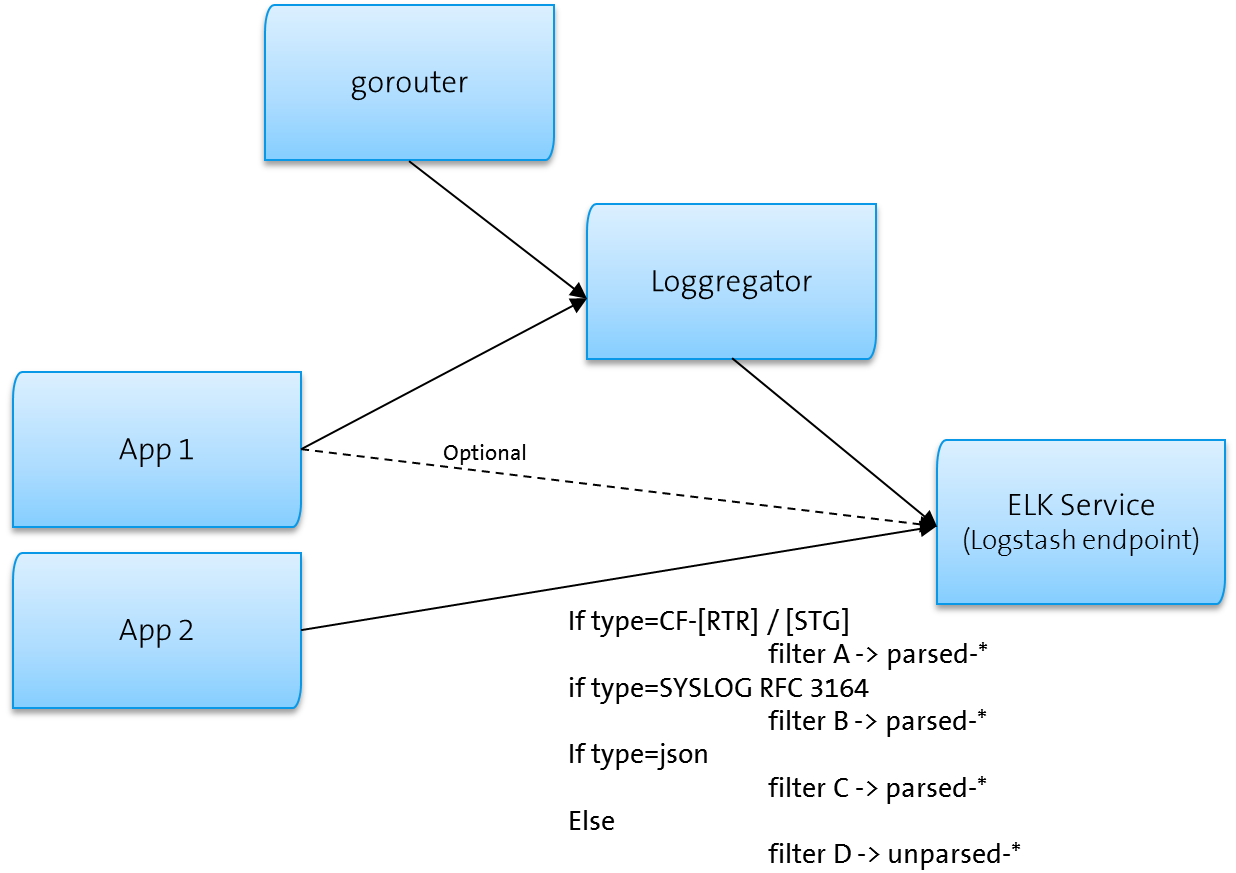
Patterns
All messages that reach Logstash are being processed and send forward to Elasticsearch. When a message is either in Syslog format or in JSON format, then it can be properly parsed. These messages are going to an index called “parsed-”. Messages that do follow a pattern are going to an index called “unparsed-. In the parsed index are also available by default all messages coming from CF gorouter.
Note:whether you are sending logs directly from your to ELK or through the stdout, messages will follow the above pattern. Only in the latter case, your log message has been augmented by a CF Prefix.
In Kibana you can manually set up which index you need, either parsed* or/and unparsed* or _all.
Logrotation
A new index is saved every day (parsed-2015.12.17). By default for all plans all parsed indexes will be closed every 30 days. This takes them out of memory, which allows Elasticsearch to perform efficientlly, but keeps them on disk, which can be saved (through an Elasticsearch API) or reopened. After 60 days all parsed logs will also be removed from disk. Unparsed indexs will be closed after 5 days and removed from disk after 10 days. If the disk gets full, the oldest logs will be deleted automatically, until disk base usage will be under 90%.
Hint: To show all indexes within elasticsearch a user can execute the following request: curl "localhost:9200/_cat/indices?v”. To open an index a user can execute the following request to elasticsearch: curl -XPOST “localhost:9200/parsed-2015.12.06/_open”.
Parameters
In the future we will also provide service specific parameters for logrotation and similar purposes. This is not yet implemented.
View the source for this page in GitHub